You too can make dashboards: How to visualise your Airtable data in Google Data Studio
This post has been particularly popular and it’s obvious a lot of people are trying to extract meaning from their Airtable data. Where we’ve got to, is the best solution isn’t hacking together dashboards this way but to use entirely different tools. Softr.io is one option that allows you to build a front end on top of your Airtable base. In our case, we’re migrating to what we think is a better database tool that is still low code but has a “real” front end. Then we can control who sees what, when they log in and doesn’t overwhelm them with tables/views/rows/columns etc. Then creating the dashboard is much simpler!
Knack is the tool we’ve chosen and we’ve written about it here. We’ve been migrating clients to it for the last 12 months and growing our team to include more Knack developers (we still use Airtable but we’re reducing our use of it to specific scenarios). If you’d like to try it out, our affiliate link will give you 1 month free, or contact us to discuss your needs - Malcolm.
The world of data tools is quickly becoming more accessible. Which is great news for us! At Optimi, we love working with people who create positive impact in the world, and we would love to see more of these folks using data to take their impact to the next level.
So we’ve written a guide on how you can combine two free tools to centralise your data and draw valuable insights from it. Airtable is a very user-friendly platform for centralising and storing your data, and Google Data Studio adds massive data visualisation power.
This blog post is for you if:
You already use Airtable, but you’re frustrated with limitations of the built-in data visualisation features, or
You tinker with your data every now and then to track your impact and make decisions, but you would benefit from seeing important information more regularly, or
You understand the value of data dashboards but you’ve never been able to find a tool that makes it easy.
Here’s the genius part of it all. Airtable is a great tool for centralising your data and giving you one easy place to run your business from. When your data is all in one tool, you know it’s up to date and you can trust it. And now that you trust it, you can start visualising it for free!
You can build a dashboard that looks something like the picture below, and you can rest easy knowing it’ll stay up to date based on your Airtable data. And if you’re comfortable with the tools we’re using, you can connect Airtable to Google Data studio in under an hour.

Credit: Google Cloud
The recipe
Here’s the steps that we’re going to work through as you read this guide:
Sync your Airtable data to Google Sheets
Pull in the data from Google Sheets to Google Data Studio
Start visualising your data!
The key idea here is that we’re not connecting Airtable directly to Google Data Studio. We’re using Google Sheets to facilitate the connection. Google Sheets knows how to talk to Airtable, and it also knows how to talk to Google Data Studio. So it’s the perfect facilitator!
Step 1: Sync Airtable to Google Sheets (the easy way)
You have two options here. Something easy to get you started, or something flexible to give you full control.
The easy option is to use a google sheets add on called “Airtable Importer”. An awesome group of humans called Railsware have developed this handy add-on, and made it available to the world for free! Thanks, Railsware!
If you’d like to go down the “Airtable Importer” path, see this page to get started. The only limitation of the free plug in is that you have to pay if you want your data to be kept up to date. Using the free option, whenever you make a change in Airtable, it will not show up in Google Sheets automagically.
If you’re like us and you want more flexibility, then there’s another option. It’s not as easy, but on the plus side, you don’t have to pay for it! Here’s what to do.
Step 1: Sync Airtable to Google Sheets (the flexible way)
Copy our Google Sheets template
Sign in to your Google account. Go to our spreadsheet template, click File -> Make a copy. Save the spreadsheet with a name that makes sense to you, knowing that the purpose of this spreadsheet will be to hold data from the Airtable base of your choice.
Add the tables that you’d like to bring in from Airtable
Go into the Airtable base that you want to use data from, and pick a table that you’d like to visualise data from. Look at the URL. You should see something like “https://airtable.com/tblXXXXXXXXXXXXXX/viwXXXXXXXXXXXXXX?blocks=hide”. The part that starts with “viw” and ends just before the “?” is your Airtable view ID.
Find the section of the spreadsheet that looks like the image below. Type in the table name of the table you’ve picked, and copy the Airtable view ID from the URL.

Add in our open sourced code to your spreadsheet
Click on Tools -> Script editor. When the script editor window opens up, delete the existing text.

Delete this text.
We’ve written some code that can sync data from Airtable to Google Sheets, and we’ve made it publicly available (open source). Go and view the code on github, copy it and paste it into your script editor window.
Disclaimer: we are not programmers by trade, so our code is not pretty. If you’re a dev, please suggest your improvements :)
Customise the code to fit you
Find your Airtable API key on the Airtable account page. Copy it and paste it in to the script editor.

Paste your Airtable API key in here.
Next, let’s find the Base ID for the Airtable base you’d like to use. Go to the Airtable API page, and click into the base that you want. Find the part of the page that looks like this image:

The base ID is the yellow block in this image.
You’ll see your baseID on the API page, it’s the text beginning with “app” and ending with “/”. Copy this, go back to the script editor and paste it in the appropriate place.
To complete your customisation, make sure the cell range in the script editor matches the yellow range in your spreadsheet.

Make sure the highlighted cell range here matches the yellow range in your spreadsheet.
Woohoo, you are now fully customised! Now let’s make sure everything works.
Test it out
Save your progress in the script editor. Then close the script editor window and reload your spreadsheet. Note that just pressing the keyboard shortcut to refresh isn’t enough, you’ll need to click in the URL bar and press return to reload the page.
Wait for your spreadsheet to finish loading. If everything has worked, then you will see a new menu option called “Airtable to google sheets sync”.

Click on the new menu option, and choose “Manually sync all data”.
With any luck, you should see all your tables coming through from Airtable! New sheets will automatically be created for each table. The bottom of your spreadsheet should look something like this:

Check each sheet to make sure it has the Airtable data that you’re looking for. Everything look ok? Whew! Success!
Set up an automatic refresh (if you want to)
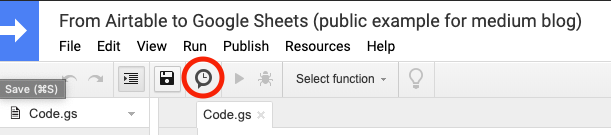
If you want your spreadsheet to automatically pull in new data from Airtable regularly, then you can set up a trigger. Go to Tools -> Script editor, and click the button which is circled in red:
You’ll be taken to another page — find the “Add trigger” button and click it. Then you can configure how often you want your spreadsheet pull through any changes from Airtable. This example shows a daily trigger:

Make sure you have chosen the “syncData” function for your trigger.
Hooray! You’re done with syncing Airtable to Google Sheets! Now the fun can really begin.
Step 2: Sync Google Sheets to Google Data Studio
Go to Google Data studio and start a new blank report. Click on “create new data source”, choose the Google Sheets connector and authorise it. Choose the spreadsheet that you have created with the Airtable data in it.
You’ll now have to add each of the sheets (AKA data tables) you want, one at a time. Pick one of the sheets that you’d like to use as a data source. You should see something like this:

When you’re happy, click “Add to report”, and you’ll be taken to a blank report page. If you’d like to add more sheets, you can click Resource -> Manage added data sources -> Add a data source.
Step 3: Visualise your data!
Now you’re ready to create the dashboards and data visualisations that will help you to make awesome decisions!
You might be ready to jump in and start playing already. If not, these resources will help you get started:
Using data visualisation to ask better questions from your data
A scientific approach to asking the right questions from your data
Remember, not all data is equal. For example, the chart below would be far less useful than a chart measuring your impact against your three top sustainable development goals!

Here’s a better example of what your dashboard could look like:

Credit: Anna Jacobson
What next?
Easy-to-build data dashboards are now at your fingertips. So now what do you do with this information? Data is only useful to you if you actually use the insights that you gain. You might want to build in regular updates to your Slack channel, or work some data checks into your regular rhythms.
Having trouble? Get in touch via email here: hello at optimi dot co dot nz
Edit: June 2021. This post has been particularly popular, obviously a lot of people are trying to extract meaning from their Airtable data. Where we’ve gotten to, is that the solution isn’t hacking together a rough metrics dashboard but instead migrating to a better database tool that has a “real” front end on it that allows us to control who sees what when they log in. Knack.com is the tool we’ve chosen and we’ve been migrating clients to it for the last 12 months and growing our team in that direction (we still use Airtable but we’ re not growing our use of it anymore) - Malcolm.
Written by Rupert from Optimi
Source: https://medium.com/@optimi/you-too-can-make-dashboards-how-to